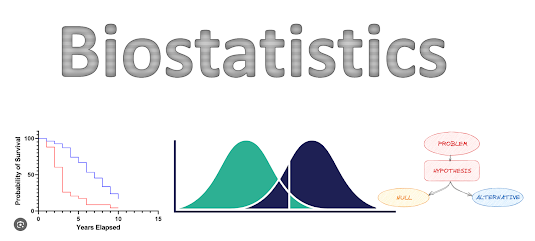
Hypothesis testing:
In simple terms, a hypothesis is an educated guess or a proposed explanation for something you observe. It's like making a prediction about what you think will happen in a certain situation based on what you already know or what you've observed. Then, through testing or investigation, you try to find out if your guess is right or if there's more to the story.
The null hypothesis is what you're testing against to see if there's enough evidence to support the alternative hypothesis, which is the idea you're really interested in proving.
Null Hypothesis: Think of this as the "default" or the idea that there's no significant difference or effect happening. It's like saying "nothing interesting is going on here." For example, if you're testing a new drug, the null hypothesis might be that the drug has no effect compared to a placebo.
Alternative Hypothesis: This is the opposite of the null hypothesis. It suggests that there is a significant difference or effect occurring. It's like saying "hey, something interesting is happening!" Using the drug example again, the alternative hypothesis would be that the drug does have an effect, making it better than the placebo.
Let's say you're curious about whether drinking coffee before taking a test improves your performance. Here's how you could set up the null and alternative hypotheses:
Null Hypothesis (H0): μ_c = μ_nc
Drinking coffee before taking a test has no effect on test performance. In other words, there's no difference in test scores between those who drink coffee and those who don't.
μ_c represents the population mean test score for the group that drinks coffee. μ_nc represents the population mean test score for the group that does not drink coffee.
The null hypothesis states that there is no difference in population mean test scores between the two groups.
Alternative Hypothesis (H1): μ_c > μ_nc
Drinking coffee before taking a test does improve test performance. This means that those who drink coffee perform better on the test compared to those who don't drink coffee.
The alternative hypothesis suggests that the population mean test score for the group that drinks coffee is greater than the population mean test score for the group that does not drink coffee.
In other words, it proposes that drinking coffee improves test performance.
We would then perform a hypothesis test to determine whether there is enough evidence to reject the null hypothesis in favor of the alternative hypothesis based on the sample data collected from the experiment.
let's say we conducted an experiment with two groups of students:
Group 1: 30 students who drank coffee before the test.
Group 2: 30 students who did not drink coffee before the test.
After administering the test, we collected the following sample data:
Group 1 (coffee-drinking group):
Sample mean test score (x̄c) = 85
Sample standard deviation (sc) = 10
Group 2 (non-coffee-drinking group):
Sample mean test score (x̄nc) = 80
Sample standard deviation (snc) = 12
We'll perform a one-tailed independent samples t-test to compare the means of the two groups.
Set up hypotheses:
Null Hypothesis (H0): μ_c = μ_nc
Alternative Hypothesis (H1): μ_c > μ_nc
Choose significance level (α):
Let's set α = 0.05.
Calculate the test statistic:
We'll use the formula for the independent samples t-test:t ≈1.75
Determine the critical value or p-value:
With 29 degrees of freedom (30 - 1 = 29) and α = 0.05, the critical value for a one-tailed test is approximately 1.699 (from t-distribution tables).
Make a decision:
Since our calculated t-value (1.75) is greater than the critical value (1.699) and falls in the critical region, we reject the null hypothesis.
Interpretation:
We reject the null hypothesis and conclude that there is sufficient evidence to suggest that drinking coffee before the test improves test performance, as the mean test score for the coffee-drinking group is significantly higher than the mean test score for the non-coffee-drinking group.

Comments
Post a Comment